Overview
Apollo analytics offers actionable data you can use to transform your company's sales efforts. With analytics reports and dashboards, you can dig into the details to see how your teams, contacts, accounts, and sales pipelines are performing. Use reports to provide feedback, hone your processes, and iterate on the best performing prospecting and outreach methods.
Check out the following sections to access and use analytics reports.
Access to analytics depends on your Apollo plan. If your team needs access to analytics reports, upgrade your plan. If you have questions about upgrading, reach out to the Apollo sales team.
Access Reports
To use reports, you need permission to access analytics. If you don't have permission, reach out to an Apollo admin who can edit your permission profile.
To access reports:
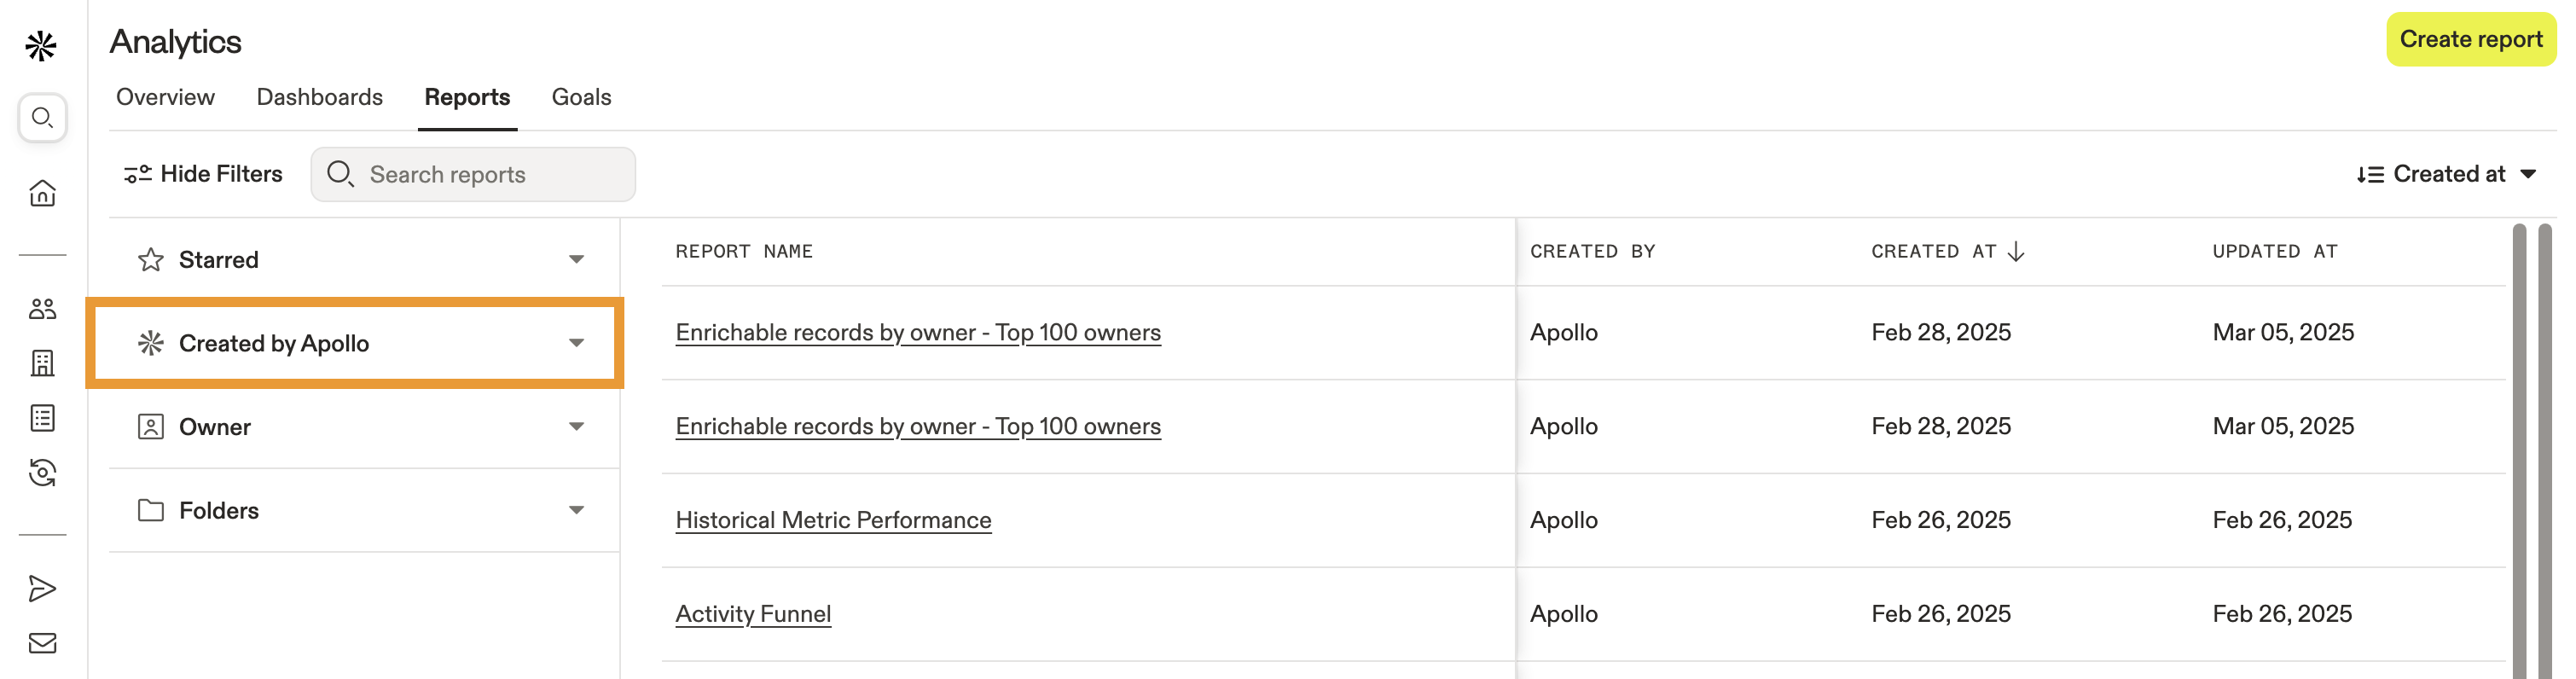
- Launch Apollo and click Analytics > Reports.
- Apollo shares your reports, organized by default by creation date.

- Use search filters like owners or folders to find specific reports or click Created by Apollo to access reports built by Apollo. Click to open a report.
Instead of manually clicking through filters and report settings, try using the AI assistant. Describe your goal in natural language and let Apollo uncover trends, surface performance gaps, and generate reports and visualizations instantly.
- Use the date range dropdown to filter for report metrics by one of the following ranges:
- Today
- Current Week
- Last 7 days
- Last 30 days
- Weekly
- Monthly
- Quarterly
- All Time
- Custom Range

- Click Add filter to filter your report metrics by user, contact, account, deals, and more. Use the dropdown to set your filter criteria. Click Remove filter to delete a filter.

- The report automatically displays metrics based on the date range and filters you applied.
You have now accessed analytics reports.
Use Pre-Built Apollo Reports
You can use the following reports created by Apollo. Click a report to learn more:
Reports built by Apollo
| Prospecting call performance funnel | Prospecting email performance funnel | Accounts prospected by user |
| Contacts prospected by user | Prospecting activity stats | # Meetings scheduled |
| # Meetings scheduled by meeting type | # Meetings cancelled | # Meetings rescheduled |
| Call funnel | Call activity by week | Reps with most effective calls |
| Most effective call sequences | Most effective call sequence step | Most engaged personas with calls |
| Most engaged contact titles with calls | Most engaged company sizes with calls | Most engaged industries with calls |
| Email funnel | Email activity by week | Reps with most effective emails |
| Most effective email sequences | Most effective email sequence step | Most effective email templates |
| Most engaged contact titles with emails | Most engaged company sizes with emails | Most engaged industries with emails |
| Website visitor daily volume trend | Top 10 companies that visited you | Top 10 pages visited |
| Number of deals by month | Deal weighted value by month | Deals conversion as percentage |
| Number of deals by deal stage and user | Deal win rate by company size | Team calls & emails activity this week by user |
| Team prospecting activity this week by user | Targeted and reached personas | Targeted and reached contact titles |
| Targeted and reached company sizes | Tasks by user by status | Deliverability by user |
| Top 5 sequences used | Top 5 used email templates | Most used email templates |
| Team activity | Team activity report - chart | Percentage of emails marked interested by rep |
| High performing sequences | Low performing sequences | Call stats |
| Rep calls with positive outcome | This week's call stats | Last week's call stats |
| Email stats | This week's email stats | Last week's email stats |
| Sales stats | # of contacts added to sequences this week | My scheduled emails |
| How many calls have we made this week? | Which industries are we reaching out to? | Which sequences are we using the most? |
Prospecting call performance funnel
This report shares your call funnel performance, with each column on the visualization representing the amount and percentage of contacts that moved from the prior status. The report table shares number of contacts, number of contacts called, number of calls connected, and number of calls connected positive.
Prospecting email performance funnel
This reports shares your email funnel performance, with each column on the visualization representing the amount and percentage of contacts that moved from the prior status. The report table shares number of contacts, number of contacts called, number of emails replied, and number of emails replied interested.
Accounts prospected by user
This report shares account touches, account emails, and account stage changes by user.
Contacts prospected by user
This report shares contacts touched, added to sequences, emailed, and changed stage by user.
Prospecting activity stats
This report shares accounts touched, contacts added to sequences, and contacts changed stage by day over time.
# Meetings scheduled
This report shares the number of meetings scheduled in Apollo.
# Meetings scheduled by meeting type
This report shares the number of meetings scheduled in Apollo by meeting type.
# Meetings cancelled
This report shares the number of meetings cancelled in Apollo.
# Meetings rescheduled
This report shares the number of meetings rescheduled in Apollo.
Call funnel
This report shares your call funnel for the current week, with number of calls scheduled, completed, logged, connected, and connected positive.
Call activity by week
This report shares your call activity by week, with number of calls logged, connected, and connected positive, as well as the percentage of calls connected and connected positive.
Reps with most effective calls
This report shares your team members with the most effective calls by number of calls dialed, connected, and connected positive, as well as the percentage of calls connected and connected positive.
Most effective call sequences
This report shares your most effective call sequences by number of calls dialed, connected, and connected positive, as well as the percentage of calls connected and connected positive.
Most effective call sequence step
This report shares your most effective call sequence step position by number of calls dialed, and percentage of calls connected, and connected positive.
Most engaged personas with calls
This report shares the personas most engaged with your team's calls by number of calls dialed, connected, and connected positive, as well as the percentage of calls connected and connected positive. Use this report to hone in on the types of people most likely to engage with your outreach.
Most engaged contact titles with calls
This report shares the contact titles most engaged with your team's calls by number of calls dialed, connected, and connected positive, as well as the percentage of calls connected and connected positive. Use this report to hone in on the types of people most likely to engage with your outreach.
Most engaged company sizes with calls
This report shares the company sizes most engaged with your team's calls by number of calls dialed, connected, and connected positive, as well as the percentage of calls connected and connected positive. Use this report to hone in on the types of companies most likely to engage with your outreach.
Most engaged industries with calls
This report shares the industries most engaged with your team's calls by number of calls dialed, connected, and connected positive, as well as the percentage of calls connected and connected positive. Use this report to hone in on the types of companies most likely to engage with your outreach.
Email funnel
This report shares your email funnel for the current week, with number of emails delivered, opened, clicked, replied, and interested.
Email activity by week
This report shares your email activity by week, with number of emails sent and interested, as well as percentage of emails opened, replied, and interested.
Reps with most effective emails
This report shares your team members with the most effective emails by number of emails sent and interested, as well as percentage of emails opened, replied, and interested.
Most effective email sequences
This report shares your most effective email sequences by number of emails sent and interested, as well as percentage of emails opened, replied, and interested.
Most effective email sequence step
This report shares your most effective email sequence step position by number of emails sent and interested, as well as percentage of emails opened, replied, and interested.
Most effective email templates
This report shares your most effective email templates by number of emails sent and interested, as well as percentage of emails opened, replied, and interested.
Most engaged personas with emails
This report shares the personas most engaged with your team's emails by number of emails sent and interested, as well as percentage of emails opened, replied, and interested. Use this report to hone in on the types of people most likely to engage with your outreach.
Most engaged contact titles with emails
This report shares the contact titles most engaged with your team's calls by number of emails sent and interested, as well as percentage of emails opened, replied, and interested. Use this report to hone in on the types of people most likely to engage with your outreach.
Most engaged company sizes with emails
This report shares the company sizes most engaged with your team's calls by number of emails sent and interested, as well as percentage of emails opened, replied, and interested. Use this report to hone in on the types of people most likely to engage with your outreach.
Most engaged industries with emails
This report shares the industries most engaged with your team's calls by number of emails sent and interested, as well as percentage of emails opened, replied, and interested. Use this report to hone in on the types of people most likely to engage with your outreach.
Website visitor daily volume trend
Website visitor reports are only available to select plans. Need access? Upgrade your Apollo plan.
To report on website visitor trends, enable website visitor tracking. Website visitor data may take up to 7 days to appear in your account.
This report shares the daily number of visitors to your website.
Top 10 companies that visited you
Website visitor reports are only available to select plans. Need access? Upgrade your Apollo plan.
To report on website visitor trends, enable website visitor tracking. Website visitor data may take up to 7 days to appear in your account.
Top 10 pages visited
Website visitor reports are only available to select plans. Need access? Upgrade your Apollo plan.
To report on website visitor trends, enable website visitor tracking. Website visitor data may take up to 7 days to appear in your account.
Number of deals by month
This report shows the number of deals by month. Use this report for insights into monthly deal revenue.
Deal weighted value by month
This report shows the deals forecast revenue by month. Use this widget for insights into monthly deal revenue.
Deals conversion as percentage
This report shows the percentage of deals that originated in your pipeline stages. Use this report to ensure deals are flowing through each stage of your deal pipeline as expected.
Number of deals by deal stage and user
This report shows the number of deals by deal stage per user. Use this widget to review deal status across your team.
Deal win rate by company size
This report shows the percentage of deals win rates by company employee size. Use this widget to hone in on the types of companies most receptive to your product or service.
Team calls & emails activity this week by user
This report shows the number of emails sent, calls completed, and tasks completed by user by week.
Team prospecting activity this week by user
This report shares the number of accounts and contacts touched, and the number of contacts added to sequences by user.
Targeted and reached personas
This report shows the number of emails sent, calls dialed, contacts added to sequences, and contacts touched by persona. Use this report to review the types of people being engaged by your team.
Targeted and reached contact titles
This report shares the number of emails sent, calls dialed, contacts added to sequences, and contacts touched by contact titles.
Targeted and reached company sizes
This report shares the number of emails sent, calls dialed, contacts added to sequences, and contacts touched by company sizes.
Tasks by user by status
This report shows the number of tasks by user that are scheduled, completed, skipped, and overdue.
Deliverability by user
This report shows email deliverability by user. Use this report to maintain deliverability across your mailboxes and teams.
Top 5 sequences used
This report shows the top 5 sequences used by number of emails scheduled and sent, and calls dialed.
Top 5 used email templates
This report shows the top 5 email templates used in sequences by number of emails sent.
Most used email templates
This report shows the most used email templates in sequences by number of emails sent.
Team activity
This report shows the number of accounts touched, contacts touched, contacts added to sequences, emails sent, and calls dialed by user.
Team activity report - chart
This report shows the number of emails sent, opened, replied, interested, and calls dialed and connected by user.
Percentage of emails marked interested by rep
This report shows the percentage of emails marked as interested by user. Use this report to spot anomalies or bottlenecks on your team.
High performing sequences
This report shows your highest performing sequences by the number of emails sent and percentage of emails interested.
Low performing sequences
This report shows your lowest performing sequences by the number of emails sent and percentage of emails interested.
Call stats
This report shows the number of calls completed, logged, connected, connected positive, and average call duration in seconds by day.
Rep calls with positive outcome
This report shows users and the percentage of their calls that connected positive.
This week's call stats
This report shows the number of calls dialed and connected, as well as the percentage of calls connected, in the current week.
Last week's call stats
This report shows the number of calls dialed and connected, as well as the percentage of calls connected, in the previous week.
Email stats
This report shows the number of emails sent, emails opened, emails replied, and percentage of emails spam blocked by day.
This week's email stats
This report shows the number of emails sent, opened, and replied, as well as the percentage of emails opened and replied in the current week.
Last week's email stats
This report shows the number of emails sent, opened, and replied, as well as the percentage of emails opened and replied in the previous week.
Sales stats
This report shows the number of accounts touched, contacts added to sequences, email sent, calls logged, and tasks completed by day.
# of contacts added to sequences this week
This report shows the number of contacts added to sequences this week by user.
My scheduled emails
This report shows the number of your scheduled emails by day of week.
How many calls have we made this week?
This report shows the number of calls dialed and connected positive by user in the current week.
Which industries are we reaching out to?
This report shows the number of emails sent, calls dialed, contacts added to sequences, and contacts touched by company industry.
Which sequences are we using the most?
This report shows the sequences with the highest usage by number of emails scheduled, emails sent, and calls dialed.
Create a Custom Report
Some Apollo plans include access to custom reports and dashboards. If your team needs to create a custom report, upgrade your plan. If you have questions about upgrading, reach out to the Apollo sales team.
To create a custom report:
- Launch Apollo and click Analytics > Reports. Click Create report.

- Click the report title to rename your custom report.

- Select a chart visualization type from one of the following options:
- Table
- Column
- Bar
- Line
- Area
- Pie
- Heatmap

- Use the dropdown to select at least 1 metric for your report. Metrics represent the items you want to learn more about, like the number of calls connected or the percentage of emails replied. Click Add metric to include additional metrics in your report. Click Delete to remove a metric from your report.

Check out the metrics glossary for details on all of the available metrics in Apollo analytics.
- Under Group by, use the dropdown to add at least 1 dimension to your report. Dimensions are how Apollo splices the data from the metrics you select. Click Add group by to include additional dimensions in your report, or click Delete to remove a dimension.

- As you add metrics and dimensions, Apollo displays a preview of your custom report visualization and a table with a more granular review of your report's metrics. You can toggle to review the visualization or table views individually.

- When you're done, click Save report.

You've now created a report and can access it from the list in Reports or add it to a custom analytics dashboard.
Metrics Glossary
You can use the following metrics with Apollo analytics:
Metrics
| Most popular metrics | Calls | Emails |
| Tasks | LinkedIn Tasks | Accounts |
| Contacts | Deals | People |
| Companies | Meetings | Website visitors |
| Conversations |
Most popular metrics
| # emails sent | The total number of emails delivered or bounced. |
| # calls logged | The total number of outbound calls made via the Apollo dialer, regardless of whether the call was answered or connected. |
| # calls connected | The total number of calls connected. |
| # emails replied | The total number of emails replied to by prospects. |
| # calls completed | The total number of calls completed. Calls included in this metric have successfully connected and ended. |
| # emails opened | The total number of emails opened, excluding bot opens. |
| # contacts added to sequence | The total number of contacts added to sequences. |
| # emails interested | The total number of emails marked interested. |
| # accounts touched | The total number of unique accounts touched via phone or email. |
| % calls connected | The percentage of calls successfully connected out of the total number of calls logged. |
| % emails opened | The percentage of emails opened, excluding bot opens, out of the total number of sent emails. |
| # contacts touched | The total number of unique contacts you attempted to connect with via calls or emails. Apollo considers contacts touched even if your call goes unanswered or your email bounces. |
| # contacts changing to stage | The total number of unique contacts changing to a selected stage. |
| % emails replied | The percentage of emails replied out of the total number of emails delivered. |
Calls
| # calls scheduled | The total number of phone calls scheduled. |
| # contacts called | The total number of unique contacts called. |
| # accounts called | The total number of unique accounts called. |
| # calls connected | The total number of calls that successfully connected. |
| Avg # calls connected | The average number of calls that successfully connected per user. |
| Avg # calls per contact touched per month | The average number of calls made per engaged contact per month. |
| % call connection rate | The percentage of dialed calls that were successfully connected. |
| # calls connected positive | The total number of calls marked with a positive call disposition. |
| % calls connected positive | The percentage of calls marked with a positive call disposition out of the total number of calls logged. |
| # calls connected neutral | The total number of calls marked with a neutral call disposition. |
| % calls connected neutral | The percentage of calls marked with a neutral call disposition out of the total number of calls logged. |
| # calls connected negative | The total number of calls marked with a negative call disposition. |
| % calls connected negative | The percentage of calls dialed with a negative call disposition out of the total number of calls logged. |
| % call dials connected | The percentage of dials that resulted in a connection. |
| avg. call duration | The average call duration in seconds. |
| # calls with disposition | The total number of calls with a selected call disposition. |
| % call connected meetings | The percentage of connected calls that resulted in a scheduled meeting. |
Emails
| # emails scheduled | The total number of scheduled emails. |
| # accounts emailed | The total number of unique accounts emailed. |
| # emails delivered | The total number of delivered emails. |
| % emails delivered | The percentage of delivered emails out of the total number of sent emails. |
| # emails bounced | The total number of bounced emails. |
| % emails bounced | The percentage of bounced emails out of the total number of sent emails. |
| # emails opened | The total number of emails opened, excluding bot opens. |
| % emails opened | The percentage of emails opened, excluding bot opens, out of the total number of sent emails. |
| # emails opened (unfiltered) | The number of emails opened, including bot opens. |
| % emails opened (unfiltered) | The percentage of emails opened, including bot opens, out of the total number of sent emails. |
| # emails clicked | The total number of clicked emails, excluding bot clicks. |
| % emails clicked | The percentage of clicked emails, excluding bot clicks, out of the total number of sent emails. |
| # emails clicked (unfiltered) | The number of emails clicked, including bot clicks. |
| % emails clicked (unfiltered) | The percentage of emails clicked, including bot clicks, out of the total number of sent emails. |
| # emails replied | The total number of emails replied. |
| % emails replied | The percentage of delivered emails that received a reply from one of the recipients. |
| % email replies that lead to meetings | The percentage of email replies that resulted in a scheduled meeting. |
| % emails delivered that lead to meetings | The percentage of delivered emails that resulted in a scheduled meeting. |
| # emails interested | The total number of interested emails. Apollo recognizes an interested email when it results in a calendar event or when an Apollo user manually marks a prospect's reply as Interested. |
| % emails interested | The percentage of outbound emails that got a positive response out of the total number of sent emails. Apollo recognizes an interested email when it results in a calendar event or when an Apollo user manually marks a prospect's reply as Interested. |
| # emails unsubscribed | The total number of unsubscribed emails. |
| % emails unsubscribed | The percentage of unsubscribed emails out of the total number of sent emails. |
| # emails spam blocked | The total number of spam blocked emails. |
| % emails spam blocked | The percentage of spam blocked emails out of the total number of sent emails. |
| email deliverability score | The average email deliverability score on all mailboxes. |
| # emails sent | The total number of emails delivered or bounced. |
| Avg # emails sent per contact | The average number of emails sent per contact. |
| # negative sentiment emails | The total number of replies classified as a negative prospect sentiment. |
| # positive sentiment emails | The total number of replies classified as a positive prospect sentiment. |
| % negative sentiment emails | The percentage of replies classified as a negative prospect sentiment. |
| % positive sentiment emails | The percentage of replies classified as a positive prospect sentiment. |
Tasks
| # tasks | The total number of tasks completed, scheduled, or skipped. |
| # tasks scheduled | The total number of tasks scheduled but not yet completed. |
| # tasks completed or skipped | The total number of tasks completed or skipped. |
| # tasks completed | The total number of tasks completed. |
| % tasks completed | The percentage of tasks completed out of the total number of tasks. |
| # tasks completed on time | The total number of tasks completed on tasks. |
| % tasks completed on time | The percentage of tasks completed on time out of the total number of tasks. |
| % total tasks completed on time | The percentage of tasks completed on time out of the total number of tasks including scheduled, completed, or skipped. |
| # tasks skipped | The total number of tasks skipped. |
| % tasks skipped | The percentage of tasks skipped out of the total number of tasks completed or skipped. |
| # overdue tasks | The total number of scheduled or completed tasks past their due date. |
| # unfinished overdue tasks | The total number of tasks not completed and past their due date. |
LinkedIn Tasks
| # LinkedIn tasks scheduled | The total number of LinkedIn tasks scheduled but not yet completed. |
| # LinkedIn tasks completed or skipped | The total number of LinkedIn tasks completed or skipped. |
| # LinkedIn tasks completed | The total number of LinkedIn tasks completed. |
| % LinkedIn tasks completed | The percentage of LinkedIn tasks completed out of the total number of LinkedIn tasks. |
| # LinkedIn tasks completed on time | The total number of LinkedIn tasks completed on time. |
| % LinkedIn tasks completed on time | The percentage of LinkedIn tasks completed on time out of the total number of LinkedIn tasks. |
| # LinkedIn tasks skipped | The total number of LinkedIn tasks skipped. |
| % LinkedIn tasks skipped | The percentage of LinkedIn tasks skipped out of the total number of LinkedIn tasks. |
| % LinkedIn tasks that lead to meetings | The percentage of LinkedIn tasks that resulted in a scheduled meeting. |
| Avg # LinkedIn tasks that lead to meetings | The average number of LinkedIn tasks that resulted in a scheduled meeting. |
Accounts
| # accounts called | The total number of unique accounts called. |
| # accounts emailed | The total number of unique accounts emailed. |
| # accounts | The total number of unique accounts prospected. |
| $ account total revenue | The sum of account revenue in thousands of US dollars. |
| $ account average revenue | The average of account revenue in thousands of US dollars. |
| # accounts in stage | The total number of accounts in a selected stage. |
| # accounts changing to stage | The total number of accounts changing to a selected stage. |
| # accounts changing from stage | The total number of accounts changing from a selected stage. |
| # accounts changing stage | The total number of accounts changing stage. |
| % accounts touched | The percentage of total accounts that were engaged. |
| Avg # accounts touched | The average number of accounts that were engaged per user. |
Contacts
| # contacts called | The total number of unique contacts called. |
| # contacts emailed | The total number of unique contacts emailed, where at least 1 email delivered without bouncing. |
| # contacts | The total number of unique contacts prospected. |
| # contacts removed from sequence | The total number of contacts removed manually from a sequence. Contacts marked as Finished don't count toward this metric. |
| # contacts in stage | The total number of contacts in a selected stage. |
| # contacts changing from stage | The total number of contacts changing from a selected stage. |
| # contacts changing stage | The total number of contacts changing stage. |
| # contacts changing jobs | The total number of unique contacts that have changed jobs or roles. Apollo only counts contacts with active job changes that haven't been accepted or dismissed by an Apollo user yet. |
| # of job changes | The total number of unique contacts that have available job change data. |
| % contacts touched | The percentage of total contacts that were engaged. |
| Avg # contacts touched | The average number of contacts that were engaged per user. |
Deals
| # deals | The total number of deals. |
| # deals won | The total number of deals closed-won. |
| # deals closed | The total number of deals closed-lost or closed-won. |
| $ deal total amount won | The total revenue across deals with a status of closed-won. |
| $ deal avg. amount won | The average deal revenue across deals with a status of closed-won. |
| $ deal total weighted forecasted revenue | The total forecasted revenue across deals. Apollo calculates forecasted revenue with the following formula: Deal probability (based on the opportunity stage) * Deal amount / 100. |
| $ deal average weighted forecasted revenue | The average forecasted revenue across deals weighted by deal stage probability. |
| $ deal total amount | The total deal amount across all deals. |
| $ deal avg. amount | The average deal amount across all deals. |
| deal avg. sales cycle in days | The average sales cycle length by deal, calculated by the amount of time that passes between first touch with a prospected and a closed deal. |
| % deal win rate | The percentage of closed-won deals out of the total number of deals closed-won or closed-lost. |
| $ deal pipeline generated | The total revenue across deals with a stage forecast category of pipeline, best case, commit, or closed. |
| # deals in stage | The total number of deals in a selected deal stage. |
| # deals changing stage | The total number of unique deals that have changed deal stage at least once. |
People
| # net new people | The total number of new people that have not been prospected yet. |
Companies
| # net new companies | The total number of new companies that have not been prospected yet. |
Meetings
| # meetings scheduled (Apollo) | The total number of meetings scheduled in Apollo. Meetings booked externally (outside of Apollo) don't count toward this metric. |
| # meetings cancelled | The total number of meetings cancelled in Apollo. |
| # meetings rescheduled (Apollo) | The total number of meetings rescheduled in Apollo. |
| # all meetings scheduled | The total number of meetings scheduled, regardless of whether scheduled in Apollo or externally. |
| # all meetings rescheduled | The total number of meetings rescheduled, regardless of whether they were rescheduled in Apollo or externally. |
| # meetings held | The total number of meetings successfully completed. |
Website visitors
| # website visitors | The total number of website visitors to your domains. |
Conversations
| # conversations recorded | The total number of conversations recorded in Apollo. |
| # upcoming conversations | The total number of upcoming conversations. |
| speaker switches | The total number of times the speaker switched between the team member and a customer across all conversations. |
| average longest customer story (in ms) | The average duration of the longest customer monologue across all conversations, in milliseconds. |
| average patience (in ms) | The average duration between a customer speaking and the team member speaking across all conversations, in milliseconds. |
| average talk ratio | The average talk ratio across all conversations. |
| average question rate | The average questions rate across all conversations. |
| average longest monologue (in ms) | The average duration of the longest team member monologue across all conversations, in milliseconds. |
Edit a Report
You can edit your custom reports at any time. To edit a custom report:
- Launch Apollo and click Analytics > Reports.
- Click to open the custom report you want to edit.
You can't edit pre-built Apollo reports, but you can duplicate pre-built reports to customize them however you need. When you open a pre-built report, click Duplicate report to create a copy, then edit the duplicate.

- Click Edit report.

- Add or edit metrics and dimensions as needed. You can also update your report's name by clicking the report title.
- When you're done, click Save report.
You've now edited your custom report.
Share a Report
You can manage access permissions to allow your entire team or select team members to view your custom report. To share access:
- Open your custom report from Reports.
- Click Share.

- Under Share with, enter the email or name for each user or team you want to give access to your report.
- Set their access permissions to one of the following:
- Full access
- Can edit
- Can view

- To share your custom report with everyone in your company, set visibility to Everyone.

- Click Done to save your changes.
Next Steps
Check out these additional resources to make the most of Apollo’s analytics insights:
| Use Analytics Dashboards | Use analytics dashboards to spot bottlenecks at a glance and keep your pipeline moving. |
|---|---|
| Analytics Overview | Check your analytics overview to monitor the health of your sales activities and set clear goals for your team. |
| Build an Outbound Sales Process: Monitor Your Analytics | Monitor your analytics to test, experiment, and fine-tune your outbound sales approach. |